 Facebook
 X
X
 Pinterest
 Copy Link
2024 Holiday Happenings Around the Sound

OK, who is ready to beat the gloom? Below are some Seattle-area holiday favorites to help brighten your spirits. You can bundle up and bask in breathtaking outdoor light shows, or just relax and enjoy from the comfort of a cruise ship or theater seat…
Winterfest at Seattle Center
305 Harrison Street, Seattle, WA 98109
www.seattlecenter.com/winterfest
- Dates/Times: Nov. 29, 2024 – Dec. 31, 2024. Holiday lighting up Nov. 21 – Dec. 31; ice sculpting Nov. 29, 12-3 pm; Winterfest train & village open daily Nov. 29 – Dec. 31 | 10 am – 6 pm; Seattle Christmas Market open Nov. 21 – Dec. 23.
- Cost: General admission is free for all ages; Seattle Christmas Market is $16-$20 for adults (buy tickets)
- Parking: Paid parking available at the Mercer Garage, 5th Ave N Garage, and Theatre Commons ADA Lot. Click here for the campus map.
- Food: A multitude of dining options await you in the Armory.
- Special Events: Opening Day Celebration, live stage entertainment at the Armory, the Winter Train & Village, New Year’s Eve Celebration Dec. 31 from 8pm-12 Midnight, and more!
- Holiday Closure: Christmas day

Photo by Nitish Meena on Unsplash
Enchant at T-Mobile Park
1250 1st Ave S, Seattle, WA 98134
https://enchantchristmas.com
click here to get tickets
- Dates/Times: 11/22/24 – 12/29/24 | See full schedule here
- Cost: $27 – $46 per adult (youth, senior & military discounts; ages 3 and under are free) | Packages, upgrades & suites available
- Promotions: 10% discount for groups of 10+
- Parking: Reserve parking in the Mariners Garage or check out the city’s Interactive Parking Map
- Food: Seasonal food and treat concessions throughout
- Activities: Ice skating trail, light maze, children’s play place, nightly caroling, visits with Santa, live entertainment, shopping village
- Closures: Most Mondays, 11/26, 11/28, & 12/6
The Nutcracker by Pacific Northwest Ballet
McCaw Hall | 321 Mercer St, Seattle
pnb.org/nutcracker/
click here to get tickets
- Dates: November 29 – December 28, 2024
- Cost: $29-$228 per seat
- Parking: Mercer Street Garage or Other Nearby Parking
- Food: Beverages and snacks are available for purchase
Garden d’Lights at Bellevue Botanical Garden
12001 Main Street, Bellevue WA 98005
http://gardendlights.org
click here to get tickets (must be purchased online)
- Dates/Times: Open nightly Nov. 30, 2024 – Dec. 31, 2024 | 4:30 – 9:00 pm
- Cost: $8 per person (ages 10 and under are free)
- Promotions: Discounted $5 ticket nights Dec. 2-5 and 9-12.
- Parking: Premium parking is $5 per car in the Garden’s lot as space allows OR park for free at Wilburton Hill Park
- Food: Hot drinks and snacks are available for purchase (outside food/beverages not allowed)
- Holiday Closures: Christmas day
Snowflake Lane at the Bellevue Collection
Bellevue Way & NE 8th Street, Bellevue WA 98004
http://snowflakelane.com/
- Dates/Times: Nightly Nov. 29, 2024 – Dec. 24, 2024 | 20 minute show starts at 7 pm
- Cost: Free for all ages
- Parking: Free parking at Bellevue Square, Bellevue Place and Lincoln Square
- Food: A variety of dining options (from happy hour, to kid fare, to gourmet) are all within walking distance
- Special Events & Activities: Ice Skating, Santa Photos

Photo by Adobe Stock
Christmas Ship Festival
Launch locations include Seattle Waterfront – Pier 55, Shilshole Bay Marina, Hyatt Regency Lake Washington, Lake Union Park (MOHAI), AGC Marina, Carillon Point Marina, and Kirkland City Dock.
www.argosycruises.com
click here to get tickets
- Dates/Times: Click here for the full schedule
- Cost: $49 – $76 per adult (discounts for youth & seniors, kids 3 and under are free)
- Parking: Varies by location – click here for details
- Food: Snacks and drinks available for purchase on the ship. Outside food/drinks are not allowed.
- Special Events: Opening Night, Parade of Boats, Grand Finale
Westlake Center Tree Lighting & Holiday Activities
401 Pine St., Seattle, WA 98101 (Westlake Park)
https://downtownseattle.org/events/holidays/
https://downtownseattle.org/events/holidays
- Tree Lighting Celebration: Nov. 29, 2024 from 12:00-5:30 pm in Westlake Park (tree lighting is at 5pm).
- Wintry Weekend with Ice Skating Rink: Dec. 13-15, 2024 from 12:00-6:00 pm in Occidental Square with a holiday trading post on Friday and Saturday, and visit from the Kraken’s Buoy the Troll on Sunday at noon.
- Cost: Free for all ages
- Parking: Access the Republic Parking garage from Olive Way between 4th & 5th Ave, or check out this interactive map of city parking

Photo by Lokesh Singh Masania on Unsplash
Zoolights at Point Defiance Zoo & Aquarium
5400 N Pearl St, Tacoma, WA 98407
www.pdza.org/event/zoolights
click here to get tickets
- Dates/Times: Open nightly Nov. 29, 2024 – Jan. 5, 2025 | 4:30 – 10 pm
- Cost: $14-$20 (free for kids 2 & under)
- Promotions: Discounted tickets for zoo members
- Parking: Free parking in zoo lots (carpooling recommended)
- Food: Dinner, drinks & snacks are available at the Plaza Cafe & outside stands. Try the new fried apple cinnamon fries or a hot cocoa float.
- Activities: Carousel, Groovy Goats in Holiday Coats
- Holiday Closures: Christmas Eve & Christmas day
WildLanterns at Woodland Park Zoo
West Entrance: 5500 Phinney Ave. N, Seattle, WA 98103
South Entrance: 750 N 50th St, Seattle, WA 98103
www.zoo.org/wildlanterns
Click here to get tickets | Map
- Dates/Times: Open nightly Nov. 15, 2024 – Jan. 19, 2025 | 4:00 – 9:00 pm.
- Cost: $29.95 – $33.95 per person (ages 2 & under are free).
- Promotions: Zoo members get 20% off tickets; 40% off general zoo admission when you buy a WildLanterns ticket; Holiday Senior Stroll on Nov. 19 & Dec, 3 from 4-7 pm with 40% off for ages 65+
- Parking: $7 parking is available in all lots after 3:30 pm (here is a map). If you bought your tickets online, the South Gate (Hippo Lot) is reserved just for those who already have tickets. If you’re planning to purchase tickets in person, park by the West Entrance (Penguin, Otter, or Bear Lot).
- Food: Dining options available in the zoo, including The Frosted Glass 21+ space. You are also welcome to bring your own food & non-alcoholic beverages.
- Special Activities: Night Owls 21+ events; Private Snow Globes; Live performances in the PACCAR Auditorium; Zoomazium; ZooStore; Carousel; Sensory-Friendly Nights on 11/20, 12/11 & 1/9.
- Closures: Closed Mondays (except for Dec. 16, 23 & 30); Closed Thanksgiving, Christmas Eve, Christmas day and New Year’s eve.

Photo by Adobe Stock
But wait, there’s more…
Holiday theatrical & musical shows
“A Christmas Carol” at ACT Theatre
“Wonderland: A Carnival of Winter Wonder” at the Can Can
The Great Figgy Pudding Caroling Competition
The Polar Express train ride at Mt. Rainier Railroad
Gingerbread Village at the Sheraton Grand Seattle
Santa Limited Train in North Bend
Festival of Trees & Teddy Bear Suite at the Fairmont Olympic
Gingerbread Village at Sheraton Grand Seattle

We earn the trust and loyalty of our brokers and clients by doing real estate exceptionally well. The leader in our market, we deliver client-focused service in an authentic, collaborative, and transparent manner and with the unmatched knowledge and expertise that comes from decades of experience.
© Copyright 2024, Windermere Real Estate/Mercer Island.
Selling Your Home: 5 Common Myths

Selling your home is a crash course in real estate education. My clients learn a LOT as we work together to find a buyer and sell at the right price. As you prepare to sell, it’s important to remember that that not everything you’ve heard is true. There are several common myths that can lead to costly mistakes in the selling process. Knowing the truth behind them will clarify your selling journey and help you align your expectations…
Myth 1: Home Value Calculators Are 100% Accurate
Online Automated Valuation Models (AVMs) are a great starting point for understanding how much your home could be worth. However, they are merely a first step in determining home value; to say they are 100% accurate is a myth. When it comes to pricing your home, you need to rely on a true Comparative Market Analysis (CMA), which uses vast amounts of historical and current data on real estate listings to arrive at an accurate and competitive figure.
To get an estimate of how much your home is worth, try our Home Worth Calculator here:

Myth 2: Selling FSBO Will Save You Money
Selling a home requires an intimate knowledge of the housing industry and how to solve the complex situations that arise throughout a real estate transaction. Despite this, some sellers will go it alone and attempt to sell their property without being represented by an agent.
Selling For Sale by Owner (FSBO) is a risky proposition. It requires the seller to bear added liability, fills their schedule with various marketing and promotional responsibilities, and can leave money on the table by inaccurately pricing the property, causing it to sit on the market for too long. The potential costs of selling a home on your own far outweigh the commission real estate agents earn on a home sale.
Myth 3: You Must Remodel to Sell Your Home
The question you’ll face when preparing to sell your home is whether to sell as is or remodel. The answer usually lies somewhere in between, but it depends on your situation and what kinds of home upgrades are driving buyer interest locally. When making improvements to your home, lean toward high ROI remodeling projects to get the best bang for your buck, and avoid trendy projects that can delay listing your home. If you’re considering major upscale renovations, talk to me about which projects buyers in your area are looking for.
Myth 4: Never Accept the First Offer
You’ve likely heard tell that the first buyer’s offer is nothing more than a springboard to up your asking price and to never accept it. In this case, “never” should be approached with caution. In reality, the best offer for your home is one that you and your listing agent have discussed that aligns with your goals. If a matching offer happens to be the first one that comes your way, so be it. The market can shift at any time, so you never know what may happen if you leave an offer on the table. And if the buyer backs out of the deal, you and your agent will find a path forward.
Myth 5: Home Staging Doesn’t Make a Big Difference
Staging your home is so much more than a cosmetic touch-up; it has been proven to help sell homes faster and at a higher price than non-staged homes.1 Staging ensures that your home has universal appeal, which attracts the widest possible pool of potential buyers. When buyers are able to easily imagine living in your home, they become more connected to the property. You should stage your home regardless of your local market conditions, but it can be especially helpful in competitive markets with limited inventory where even the slightest edge can make all the difference for sellers.
Now that you know some of the most common myths in the selling process, get to know its truths. Connect with me to get the process started:

1: National Association of REALTORS® – Why Home Staging Inspires the Best Prices in Any Housing Market
We earn the trust and loyalty of our brokers and clients by doing real estate exceptionally well. The leader in our market, we deliver client-focused service in an authentic, collaborative, and transparent manner and with the unmatched knowledge and expertise that comes from decades of experience.
This article originally appeared on the Windermere Blog, written by: Sandy Dodge.
How’s the Market? Q3 2024 Review of Seattle Area Real Estate

While Q3’s summertime market slowed a bit from the frenetic spring pace of Q2 (we call this the “Summer Slump”), median home values are up across the region compared to this time last year. Most homes still sold at or above their listed prices in the first 10 days on market. However, buyers had more choice with higher inventory levels AND some room to negotiate on price for those homes that stayed on the market past the 10-day mark.
What does this mean for the rest of 2024? We typically see buyer activity decrease as we head into the holidays, and of course, it’s also election season. If you’ve been considering a purchase and are of the mindset that you don’t want to compete, THIS IS YOUR MARKET! For sellers the average days on market in Q3 was 20 for Seattle and 18 for the Eastside. Which means: if your price didn’t attract a buyer in the first two weeks, it’s probably time to re-evaluate. Interest rates are better than they’ve been since mid 2022. Quality inventory is being presented to the market. If you see a great house, be prepared to move quickly. Opportunity Knocks.
Click or scroll down to find your area report:
Seattle | Eastside | Mercer Island | Condos | Waterfront
SEATTLE
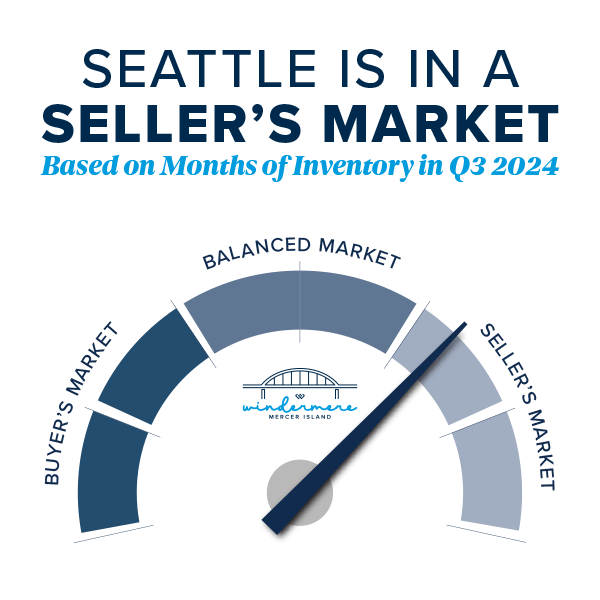
Lots of good news in Seattle during our post-summer glow. Prices are up year over year by 5% to $937,000. While we’re still under the peak median of $1,000,000 set in Q2 of 2022 and $970,000 from last quarter, this is so typical for Q3. We’ve seen it every year from Q2 to Q3 going back to 2018 (except in 2020 largely because the real estate market shut down completely in Q2). Buyers had lots of choice, with more inventory to end the quarter than we’ve had since Q3 of 2022. Even with these buyer bright spots we still saw 56% of homes sell in the first 10 days and 34% over the asking price.
Average price per square foot and median price were in positive territory across the board this quarter in all neighborhoods. Richmond Beach/Shoreline and Madison Park/Capitol Hill both saw larger than typical gains in $/sq.ft. (11%) and median price (10%) respectively. North Seattle appeared to be the “hottest” market around with 64% of homes selling in the first 10 days. Again, really great numbers in Seattle given that Summer Slump was in full effect.

 Click here for the full report and neighborhood-by-neighborhood statistics!

EASTSIDE
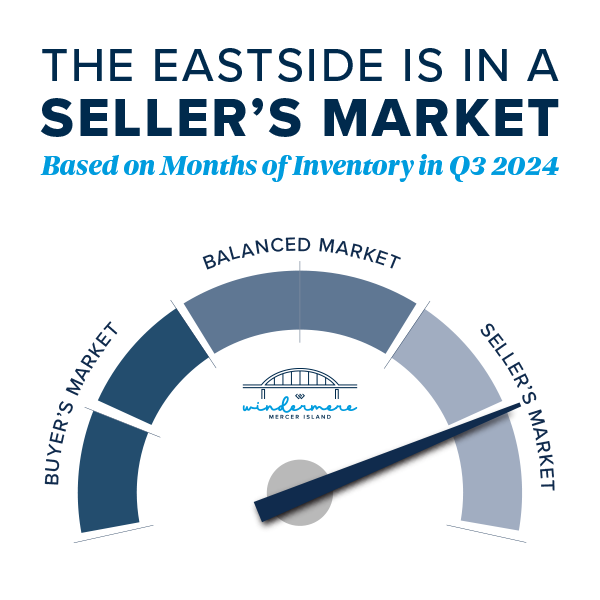
The Eastside continues to be the region’s crown jewel of real estate. Median prices are up again year over year by 8%. Most of us felt what we lovingly call the Summer Slump, and the numbers confirmed this. Prices (median) AND transactions were down 6% overall when compared against Q2 of 2024. That’s a $100,000 dip in median sales price if you missed the spring market. This is absolutely typical for the PNW and Metro King County. Seasonally our peak seasons are spring and post Labor Day/pre-holiday. This year that may be disrupted by election distractions. Time will tell if it’s a market lacking in consumer confidence or simply existential distraction.
The micro markets across the Eastside are fairly homogeneous. Among the 8 neighborhoods that we track, the median price swing was 3-11% but all in a positive direction. Total transaction volume is up 18% signaling that eventually life changes will trump a 2.5% interest rate. While homes were mostly selling in the first 10 days, multiple offers/paying over asking price were not the norm. In fact, the split between at, above, and below was relatively even.

 Click here for the full report and neighborhood-by-neighborhood statistics!

MERCER ISLAND
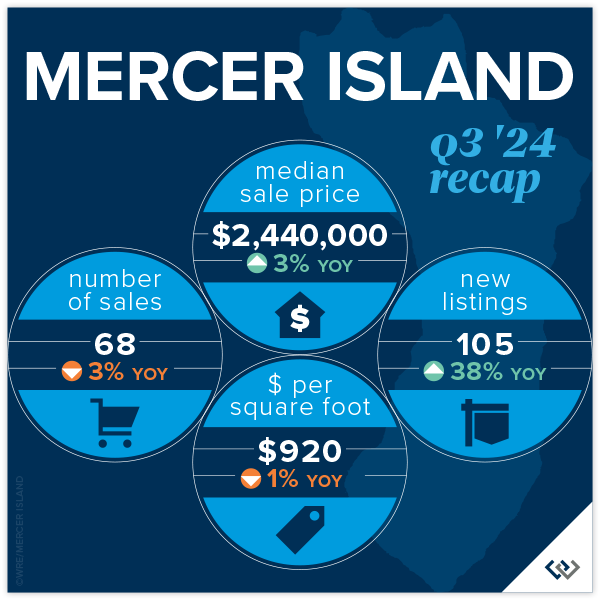
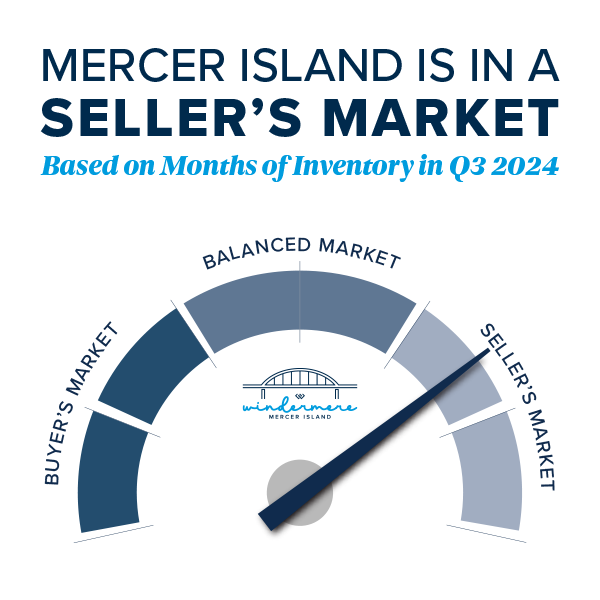
Fall has come for Mercer Island. The summer construction on Island Crest is done, school buses are out en force, and those filtered views that only come out in winter are starting to show. It’s time to look back fondly at the summer real estate market: prices are up YOY by 3% to $2,440,000 to end the quarter. This is likely more about trailing gains from a robust spring than it is about actual gains from Q3, given the indicators. A whopping 40% of homes sold under list price. It took 40% longer than 10 days to sell (not necessarily the same 40%) but only for about a 2% discount. This suggests that seller pricing and buyer motivation are evenly matched. There were 50 active listings at end of quarter, the most since Q2 of 2020 when real estate shut down completely.
Focusing on neighborhoods, The Lakes, Mercerwood, Mercerdale, and Mercer Island Estates saw 100% of homes sell in the first 10 days for an average of 102% of sales price. This goes to show that in any market, despite overall conditions, there will always be “hot homes.” Mid-Island had the most overall activity with 22 of the 68 sales across the Island. These occurred at $865/foot and 16 of the 22 homes sold in the first 10 days for at or above list price.
 Click here for the full report and neighborhood-by-neighborhood statistics!
CONDOS – SEATTLE & EASTSIDE
Once again, we’re rooting for the Seattle condo market as it proves to be the little engine that could! Chugging along toward modest price gains even when the rest of the market seems to be struggling a bit, Seattle condo prices have held steady for the last 6 quarters, with mostly positive change. Eastside condos hit a median price all-time high in Q2 at $709,000. We’re off of that a touch to $690,000 in Q3, to be expected after a beautiful summer. The Eastside ended the quarter with 29% more listings than this time last year and only 13% more sales. Mounting inventory tends to lead to price softening. Overall, nearly 50% of condos sold for at or above their list price!
When you compare the charts in the report, there is admittedly more positive news on the Eastside than in Seattle. Overall, we’re encouraged that despite many neighborhoods experiencing a drop in sales, average price per sq. ft. held flat and median price is up overall. On the Eastside it’s still great news all around for the market, especially in West Bellevue with 26% median sales price gains and total sales up 55%.
Friendly PSA: PLEASE remember that there is a ‘first rung’ of the property ladder. CONDOS create an affordable option to start building wealth at a younger age. It’s an important real estate product that has been overlooked. I am hopeful that enterprising young homeowners return to the condo market in droves this next real estate cycle.
Check out area-by-area details the full condo report.

WATERFRONT
While a bit slower compared to last quarter, waterfront sales remained strong in Q3 with 10 on the Eastside and 8 in Seattle. Lake Sammamish moderated in summer with just 5 sales compared to the crazy 15 we saw in spring, while Mercer Island stayed fairly steady with 4 (compared to 6 in spring). The highest sale was nearly $18 million for an immense Wendell Lovett designed 6,920 sq. ft. home on 125 feet of prime “gold coast” waterfront in Medina. The most modest sale was also on the Eastside—an original 1943 cottage on 53 feet of west-facing waterfront in Kennydale.
This brief overview of the entire Seattle-Eastside private waterfront market, including Mercer Island and Lake Sammamish, illustrates the trends occurring in our region over time. This data is interesting and insightful but cannot replace an in-depth waterfront analysis with your trusted professional.
We earn the trust and loyalty of our brokers and clients by doing real estate exceptionally well. The leader in our market, we deliver client-focused service in an authentic, collaborative, and transparent manner and with the unmatched knowledge and expertise that comes from decades of experience.
© Copyright 2024, Windermere Real Estate/Mercer Island. Information and statistics derived from Northwest Multiple Listing Service and Trendgraphix, and deemed accurate but not guaranteed. Seattle cover photo courtesy of Kathryn Buchanan and Brandon Larson, Clarity Northwest Photography. Mercer Island cover photo courtesy of The Sirianni Group and Clarity Northwest Photography. Condo cover photo courtesy of Julie Wilson and Bobby Erdt, Clarity Northwest Photography. Waterfront cover photo courtesy of Anni Zilz and Andrew Webb, Clarity Northwest Photography.
Our Favorite Local Pumpkin Patches

Grab your boots, pack a thermos…it’s time to choose those perfect Halloween pumpkins! This year, why not explore a new town and make your pumpkin patch experience a true adventure? All of these farms are open every weekend in October, and some are open on weekdays too. Some even welcome your furry family members on a leash. Scroll down for the full scoop!
Eastside | North of Seattle | South of Seattle
Eastside
Fletcher Farm
Dog-friendly with a scavenger hunt, farm animal zoo, storybook trail, mini-golf, photo stations, and junior corn maze for the little ones. End of season Halloween Bash, too!
Open Sat & Sun, 11a-6p | Every weekend from 9/28-10/27
18712 SE May Valley Road | Issaquah
fletcherfarmevents@gmail.com
fletcherfarmissaquah.com
Jubilee Farm
Hay rides, food trucks, animals, barn store, & hot apple cider.
Open Sat & Sun, 10a-5p | Every weekend in October
229 W Snoqualmie River Rd NE | Carnation
(425) 222-4558
jubileefarm.org
Novelty Hill Farm
Dog-friendly! Corn maze, farm critters, trike track, hay mow, & picnic/fire pit rentals.
Open Fridays, 3-6p & Sat/Sun, 10a-5p | 9/27-10/27
26617 NE 124th Street | Duvall
(425) 788-2416
noveltyhillfarm.com
Oxbow Farm & Conservation Center
Live music, face painting, clue hunt, hay rides, mini pumpkin painting, living playground, kids’ farm tours, & apple slingshot.
Sat, 10/19 & Sun, 10/20 | 10a-4p
10819 Carnation-Duvall Rd. NE | Carnation
(425) 788-1134
oxbow.org/oxtober
Remlinger Farms
25 rides & attractions for children (including a train, carousel, & mini roller-coaster!), pony rides, apple cannon, cafe, & brewery with 20 choices on tap.
Open Sat & Sun, 10:30a-4:30p | Every weekend from 9/28-10/27
32610 NE 32nd Street | Carnation, WA
(425) 333-4135
remlingerfarms.com
Serres Farm
Mini train rides, corn maze and a dazzling variety of specialty pumpkins.
Open Sat & Sun, 9a-5p | Every weekend in October
20306 NE 50th St | Redmond, WA
(425) 868-3017
serresfarm.com/pumpkin-patch
Two Brothers Pumpkins at Game Haven Farm
Farm animals and an eerie number of well-attired scarecrows.
Open 9:30a-6p | Every weekend in October
7110 310th Avenue NE | Carnation, WA
(425) 333-4313
facebook.com/twobrotherspumpkins
North of Seattle
Bailey Vegetables
U-pick apples and kids play area with hay run, farm trikes & sandbox. Weekend kettle corn, cider and donuts, too!
Open Weekends, 10a-5:30p & Weekdays 12-5:30p | Late September-October
12698 Springhetti Rd | Snohomish
(360) 568-8826
baileyveg.com/pumpkin-patch
Bob’s Corn & Pumpkin Farm
12-acre corn maze, 2 kids’ mazes, play barn, hay rides, trike track, & apple cannon. Fire pit rentals for private groups, too!
Open Daily, 10a-7p (Last entry @5p) | 9/14-10/31
10917 Elliott Road | Snohomish
(360) 668-2506
bobscorn.com/Pumpkins
Carleton Farm
Corn maze, play area, jump pad, paintball shooting gallery, apple cannons, hay rides, & kids’ bucket train.
Open M-Sa, 10a-6p & Sun, 10a-5p | 9/28-10/31
630 Sunnyside Blvd SE | Lake Stevens, WA
(425) 343-4963
carletonfarm.com
Craven Farm
15-acre corn maze, kids maze, axe throwing, farm animals, mini golf, cow train, foosball, apple cannon, espresso, cider donuts, & scarecrow making. Fire pit rentals and special dog-friendly days, too!
Open Fri-Sun, 9:30a-6p | 9/14-9/30
Open Wed-Sun, 9:30a-6p | 10/1-10/27
13817 Short School Road | Snohomish
(360) 568-2601
cravenfarm.com/fall-festival
Fairbank Animal & Pumpkin Farm
Lots of baby animals, corn “maize maze,” tiny tot hay tunnel, toy duck races, photo boards, & veggie garden.
Open 10a-5p | Every weekend in October
15308 52nd Ave W | Edmonds
(425) 743-3694
fairbankfarm.com
Stocker Farms
30+ attractions including a mega slide, giant jumping pillow, tire mountain, epic play area, zip line, corn maze, pumpkin cannon, & more. The farm’s evil twin, Stalker Farms, comes out at night.
Open Daily 10a-6p (Last entry @5p) | September 21, 22, 28, & 30 | October 1-31
8705 Marsh Rd | Snohomish
(360) 568-7391
stockerfarms.com
Swans Trail Farms
Washington State corn maze, kids corn maze, petting farm, wagon rides, big slides, zip lines, u-pick apple orchard & live duck races.
Open Daily 10a-6p (Last entry @5p) | 9/14-10/31
7301 Rivershore Rd | Snohomish
(425) 330-3084
swanstrailfarms.com
South of Seattle
Carpinito Brothers Corn Maze & Pumpkin Patch
Rubber duck races, hay slides, corn pit, farm animals, hay maze, & corn maze.
Open Daily 9a-6p (or until dusk) | 9/27-10/31
Pumpkin Patch: 27508 W Valley Hwy N | Kent
Farm Fun Yard: 6720 S 277th St | Kent
(206) 786-4011
carpinito.com
Maris Farms
Racing pigs & ducks, mega slide, corn maze, jump pillow, animals, zip lines, rides, plus the creepy “Haunted Woods” complete with zombies and homicidal maniacs.
Open Fri-Sat 10a-10p, Sun 10a-7p | 9/28-10/27
25001 Sumner-Buckley Highway | Buckley
(253) 862-2848
marisfarms.com
Mosby Farms
Dog-friendly! Corn maze and fresh farm market.
Open Daily 10a-5:30p | 9/28-10/30
3104 SE Auburn-Black Diamond Rd | Auburn
(253) 939-7666
mosbyfarm.com/pumpkinpatch
Spooner Farms
Corn maze, pumpkin sling shot, speedway, farm animals, caramel apples, & roasted corn.
Open Daily 9a-6p | 9/28-10/31
9710 State Route 162 East | Puyallup
(253) 840-2059
spoonerberries.com
Thomasson Family Farm
Laser tag, corn maze, play barn, farm animals, slides, duck races, trike track, apple slingshot, and giant Jenga & Connect 4.
Open Daily 9:30a-5:30p | 9/28-10/30
38223 236th Avenue SE | Enumclaw
contactus@thomassonfamilyfarm.com
thomassonfarm.com
We earn the trust and loyalty of our brokers and clients by doing real estate exceptionally well. The leader in our market, we deliver client-focused service in an authentic, collaborative, and transparent manner and with the unmatched knowledge and expertise that comes from decades of experience.
© Copyright 2024, Windermere Real Estate / Mercer Island.
Buying a Fixer-Upper
For some homebuyers, a fixer-upper is their idea of a dream home. However, the process of buying a fixer-upper comes with additional responsibilities compared to properties in better condition or new construction homes. Preparing for the process comes down to creating a remodeling plan, knowing what to look for when searching for listings, and understanding what financing options are available.
Planning for a Fixer-Upper
Fixer-uppers require a future-oriented mindset. Knowing the magnitude of the projects you and your household are willing to take on will help to form your budget and your expectations as time goes on. With some basic cost analysis for any given project, you’ll have to decide whether it’s worth it to buy the materials yourself and do it DIY or hire a professional. When testing the waters for professional remodeling, get specific quotes so you can compare costs between contractors. Understand that in addition to the down payment and closing fees, the costs involved in a fixer-upper purchase have the potential to go over-budget easily. Familiarize yourself with permitting in your area to understand how to navigate any legal roadblocks in the renovation process and to better assess your timeline for your home improvement projects.
Searching For a Fixer-Upper
- Location: Whether you are purchasing a fixer-upper with plans to sell it, rent it out, or live in it, consider its location before purchasing. If you’re planning on selling or renting, location is one of the most important factors in making a return on your investment. And if you’re planning to live in your fixer-upper, keep in mind that location will be a large part of your experience in the home. If you’re looking to sell eventually, talk to your agent to identify high ROI remodeling projects that will pique buyer interest in your area.
- Scope of Renovation: If you are looking for a smaller scale renovation, look for listings that require cosmetic projects like new interior and exterior paint, fresh carpeting and flooring, appliance upgrades, and basic landscaping maintenance. More expensive and involved projects include re-roofing, replacing plumbing and sewer lines, replacing HVAC systems, and full-scale room remodels.
- Inspections: Beyond a standard home inspection, which covers components of the home like its plumbing and foundation, consider specialized inspections for pests, roof certifications, and engineering reports. This will help differentiate between the property’s minor flaws and critical problems, further informing your decision when it comes time to prepare an offer.
Financing Options
You’ll be looking at different types of mortgages when buying a fixer-upper, but keep in mind that renovation loans specifically allow buyers to finance the home and the improvements to the property together. Extra consultations, inspections, and appraisals are often required in the loan process, but they help guide the work and resulting home value. Talk with your lender about which option is best for you.
- FHA 203(k): The Federal Housing Administration’s (FHA) 203(k) loans can be used for most projects in the process of fixing up a home. In comparison to conventional mortgages, they may accept lower incomes and credit scores for qualified borrowers.
- VA renovation loan: With this loan, the home improvement costs are combined into the loan amount for the home purchase. Contractors employed in any renovations must be VA-approved and appraisers involved in the appraisal process must be VA-certified.
- HomeStyle Loan – Fannie Mae: The HomeStyle Renovation Loan can be used by buyers purchasing a fixer-upper, or by homeowners refinancing their homes to cover the improvements. This loan also allows for luxury projects, such as pools and landscaping.
- CHOICERenovation Loan – Freddie Mac: This renovation mortgage is guaranteed through Freddie Mac, allowing projects that bolster a home’s ability to withstand natural disasters or repair damage caused by a past disaster.
If you’re interested in buying a fixer-upper, connect with me – I can help you understand the process and to discuss what makes the most sense for you.
We earn the trust and loyalty of our brokers and clients by doing real estate exceptionally well. The leader in our market, we deliver client-focused service in an authentic, collaborative, and transparent manner and with the unmatched knowledge and expertise that comes from decades of experience.
This article originally appeared on the Windermere Blog, written by: Sandy Dodge.
Understanding Contingent Offers: A Seller’s Guide

With the market shifting toward balance between buyers & sellers, “contingent” is a word sellers will be seeing more of. It’s important to understand the difference between a “contingent offer” and one with “contingencies.” Contingent offers allow the buyer time to sell their current home first before they complete the purchase. On the other hand, an offer with contingencies allows the buyer to cancel the contract with a full earnest money refund if the specified conditions aren’t met—often a satisfactory home inspection or the ability to obtain financing.
This may feel a bit like buyers want to have their cake and eat it too, but every homeowner can understand the desire to protect their investment before fully diving in. In a seller’s market, there are fewer homes available, which means buyers will do whatever they can to make their offer stand out. Because sellers have the leverage in these market conditions, you’ll often see buyers waiving their contingencies. Talk to your agent for more information about the local market conditions in which you’re selling.
Should I accept a contingent offer on my house?
Each home sale is different, and each seller has a unique story. What you’re looking for in an offer may be different from what someone else in your neighborhood is looking for when selling their home. It all depends on your circumstances, your timeline, your next steps, and your local market conditions. The extra stipulations in a contingent offer require the attention of an experienced real estate agent who can interpret what they mean for you as you head into negotiations.
How often do contingent offers fall through?
Contingent offers can fall through more often than non-contingent ones, but there’s no general rule of thumb. Whether a sellers and buyer are able to agree on the terms of a deal is a case-by-case situation. Different contingencies may carry different weight among certain sellers, and local market conditions usually play a significant role. For up-to-date information about your local market, visit our Market Reports page or Trends on our blog.
Pros and Cons of Contingent Offers for Sellers
Pros of Contingent Offers (allowing the buyer to sell their current home first):
- Accepting a contingent offer means you don’t have to take your home off the market quite yet, since the conditions of the deal haven’t been met. If the buyer backs out of the deal, you can sell without having to re-list.
- In certain cases, some buyers may be willing to pay extra to have their contingent offer met even if the home has been on the market for an extended period.
Pros of Offers with Contingencies (such as inspection, title, financing, etc.):
- You’ve got an offer! In a balanced market, one offer with contingencies is still better than no offers.
- It may protect you legally if you give the buyer the opportunity to do all of their due diligence while under contract. It’s harder for a buyer to come back and say something wasn’t disclosed when they had ample time and the contractual right to due diligence.
Cons:
- Home sales with any types of contingencies are usually slower than those without. It takes time to satisfy a buyer’s contingencies and additional time to communicate that they have been met.
- There’s a higher risk that the deal could fall through since the the buyer isn’t locked into the contract until of their contingencies have been satisfied.
It’s important to have an agent you can trust for guidance when facing contingent offers. Reach out to me any time—I’m never too busy to give advice or answer questions:
We earn the trust and loyalty of our brokers and clients by doing real estate exceptionally well. The leader in our market, we deliver client-focused service in an authentic, collaborative, and transparent manner and with the unmatched knowledge and expertise that comes from decades of experience.
This article originally appeared on the Windermere Blog, written by: Sandy Dodge.
2024 Football & Hockey Schedules, Recipes, & Tips

Football is almost here and hockey is coming in hot behind it! Scroll down for printable schedules, tailgating hacks (including how to pack the perfect cooler!), and favorite gameday recipes. Fans of all ages will also love these printable football and hockey bingo sheets.
Need to brush up on your sports lingo? Check out Wikipedia’s handy football and hockey glossaries. You can say impressive things like, “Are they running a 3-4 defense?” and “It’s not icing unless the puck passes the goal line…”


We earn the trust and loyalty of our brokers and clients by doing real estate exceptionally well. The leader in our market, we deliver client-focused service in an authentic, collaborative, and transparent manner and with the unmatched knowledge and expertise that comes from decades of experience.
© Copyright 2024, Windermere Real Estate/Mercer Island.
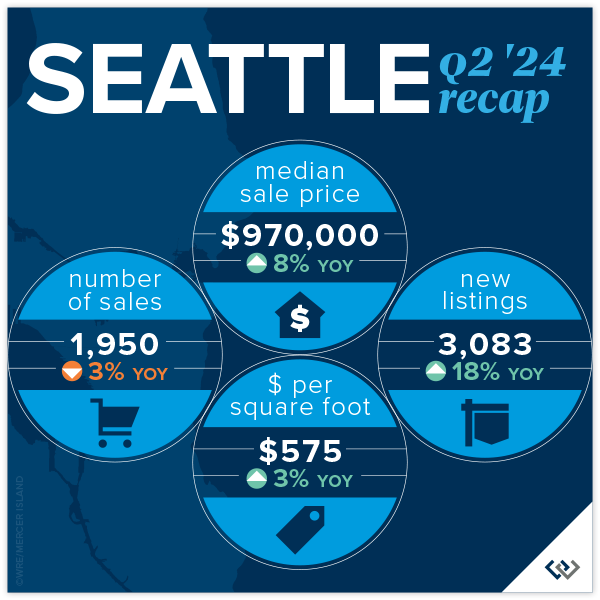
How’s the Market? Q2 2024 Review of Seattle Area Real Estate

Median sales prices were up across the region in Q2 of 2024 compared to this time last year, with the Eastside posting the highest year-over-year appreciation. What should you know that the numbers don’t show? We’re back to a typical PNW seasonal market. Higher temps typically lead buyers to lose focus. There is still quality inventory hitting the market. If you don’t need to sell in order to buy, this summer is the perfect opportunity for you. There are some great deals out there, and this fall election season will be in full swing which will surely have an impact on all markets.
Click or scroll down to find your area report:
Seattle | Eastside | Mercer Island | Condos | Waterfront
SEATTLE
The median home price in Seattle is up 8% year over year to $970,000! We are just 3% shy of the peak median price of $1,000,000 set in Q2 of 2022. With steady growth over the last couple of quarters one might assume that we’ll hit peak prices again shortly. This gain isn’t because of low inventory (up 18%) or a rapid growth in demand (sales are down 4%), it’s likely chalked up to interest rates under 7% AND buyers got tired of sitting on the sidelines. In all cases, the first half of this year has been a breath of fresh air.
Lake Forest Park saw the biggest drop in total number of sales at 34% BUT they also saw the highest jump in median price: up 19% to $1,015,000. Their neighbors to the West, Richmond Beach and Shoreline, saw the largest rise in sales with a 19% gain in total volume AND the only area to post a drop in median price. Down 1%. Madison Park/Capitol Hill is the only other area of the city to post double digit gains. All in all a robust spring quarter.
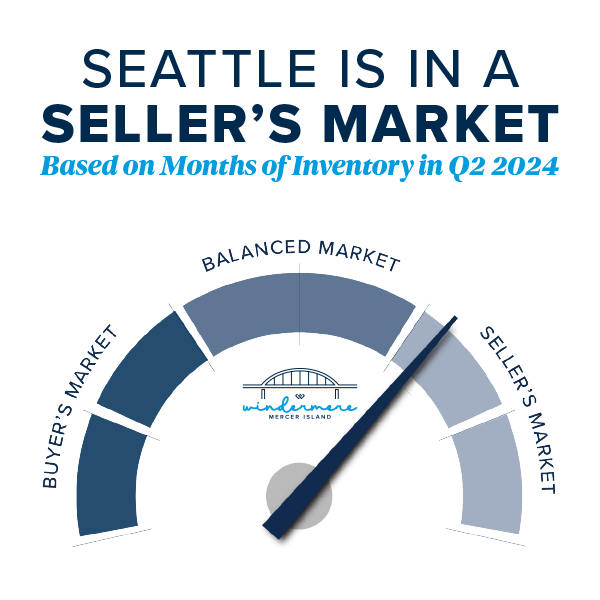
76% of homes sold for at or above list price and 71% of homes sold in the first 10 days on the market for an average of 105% of the list price. This tells us, if you find “The One,” don’t sleep on it, and be prepared to pay. Especially in the $800,000 to $1,500,000 price band.
 Click here for the full report and neighborhood-by-neighborhood statistics!

EASTSIDE
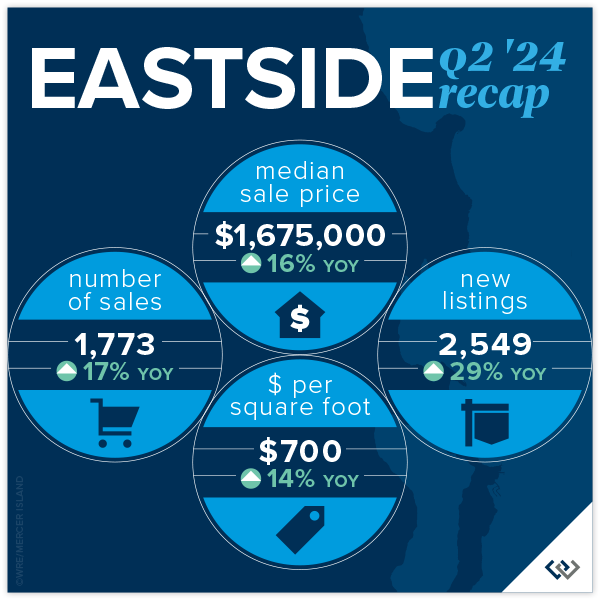
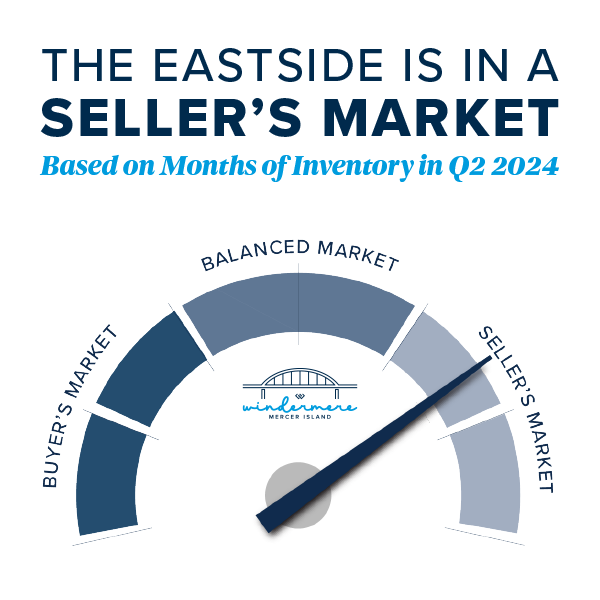
Everything’s coming up roses this spring on the Eastside. Home values have soared 16% year-over-year, with the median sale price reaching $1,675,000. This reflects a 4% gain from the peak in 2022. (Not all metro King County areas have reached peak prices again.) This impressive growth reflects a thriving market, with an average home selling for $700 per square foot, up 14% from last year. What’s even more fun? A whopping 78% of homes sold within the first 10 days of listing, showing just how bullish buyers are on the market.
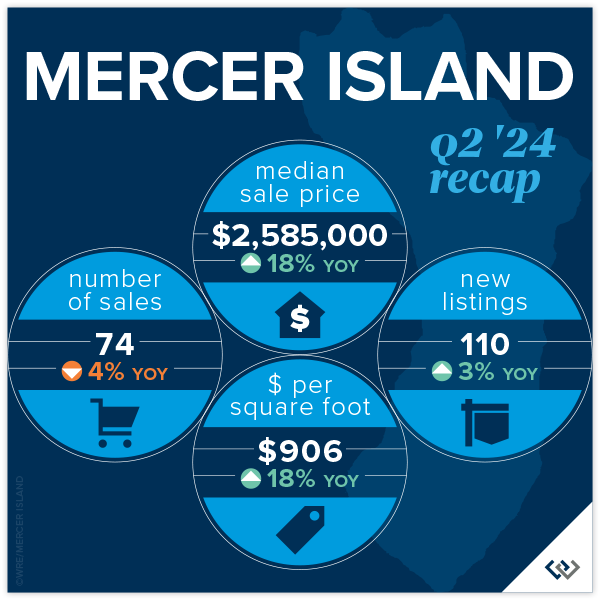
Neighborhoods across the Eastside are shining. Eastside South saw 251 homes sold, marking a 37% increase, with a median sale price of $1,799,000, up 20%. Meanwhile, West Bellevue’s median sale price jumped to $3,574,000, up 13%. Mercer Island continues to charm buyers, with homes selling for an average of $906 per square foot and a median price increase of 18%, reaching $2,585,000.
Overall, the Eastside market is buzzing with activity. With 1,773 homes sold (a 17% rise YoY), it’s clear that both buyers and sellers are seizing opportunities. The increase in new listings by 29% compared to last year adds to the market’s appeal. East Bellevue and Redmond also show significant growth, with median sale prices climbing by 7% and 27%, respectively. The Eastside has staying power post Covid, clearly.
 Click here for the full report and neighborhood-by-neighborhood statistics!
MERCER ISLAND
Home prices have seen a remarkable year-over-year increase of 18%, with the median sale price reaching $2,585,000. While this is a great sign for the health of the market, we’re still 5% below the 2022 peak. Affordability seems to be what is driving the market forward. Interest rates are down YoY. In relation to Q1 2024, prices are up a modest 2.5% which feels to us like: healthy sustainable growth.
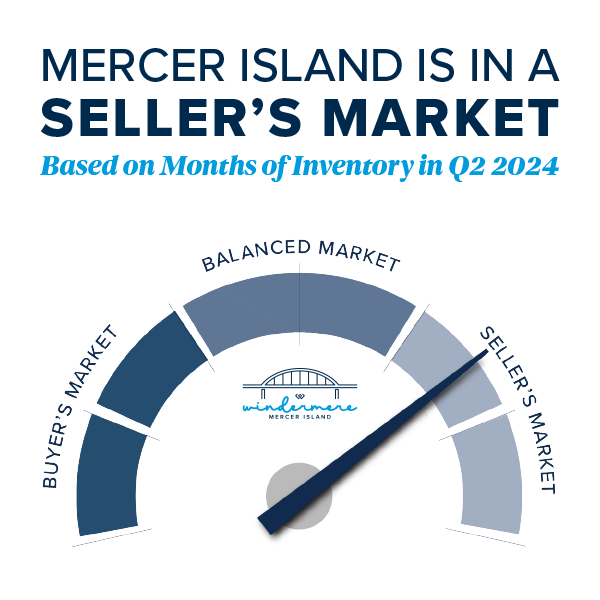
Q2 2024 saw only a 3% rise in new listings compared to the same quarter last year, while there were 3 fewer homes sold in 2024 vs. 2023. Inventory and absorption remains relatively flat year over year. So it might be surprising that there is a robust demand for Mercer Island properties, with 66% of homes sold within the first 10 days of listing and that 18% rise in median price. Lower asking prices coupled with slight interest rate relief seem to be the explanation.
Taking a peek at the neighborhood snapshot reveals varying performance across different Mercer Island areas, yet the overall trend remains positive. For instance, the Northend saw 15 homes sold at an average of $810 per square foot, with 73% of these sales occurring at or above the listing price, and 60% sold within the first 10 days. On the higher end, East Seattle and The Lakes neighborhoods showcased exceptional performance, with all homes sold at or above the listing price and achieving 100% sales within the first 10 days. Overall, the average price per square foot for the island increased year-over-year, reaching $906.
 Click here for the full report and neighborhood-by-neighborhood statistics!

CONDOS – SEATTLE & EASTSIDE
It’s good news only in the condo market! Seattle condos saw modest yet positive growth, with the median sale price rising 5% year-over-year to $636,000. The average price per square foot climbed to $649, a 7% increase, showing strong market demand. Condos in Ballard and Green Lake led the charge with a 31% increase in sales volume, while Downtown-Belltown, despite a 14% drop in sales, saw prices rise by 10%. Demand seems to be all over the board, but we’re still reporting the highest median sales price ever for Seattle condos!
On the Eastside, the market was buzzing with activity, in large part due to inventory being double what it was in Q2 of 2023. Redmond condos were the stars, with sales skyrocketing by 65% and the median sale price jumping 45% to $850,000. West Bellevue followed suit with a 38% increase in sales and a 33% hike in price per square foot, reaching $1,064. The overall Eastside market saw a 22% rise in sales and a 13% increase in the average price per square foot, now at $660.
It’s important to note that 62% of all condos selling at or above their list price across Seattle and the Eastside, showing a competitive market where buyers are eager to snap up properties quickly. With more new listings than last year there are plenty of opportunities for buyers and sellers alike. Whether you’re eyeing a trendy spot in Ballard or a luxurious condo in West Bellevue, the upbeat condo market promises exciting possibilities for everyone!
Friendly PSA: PLEASE remember that there is a ‘first rung’ of the property ladder. CONDOS create an affordable option to start building wealth at a younger age. It’s an important real estate product that has been overlooked. I am hopeful that enterprising young homeowners return to the condo market in droves this next real estate cycle.
Check out area-by-area details the full condo report.

WATERFRONT
Lake Sammamish led the pack in Q2 with a whopping 15 waterfront sales, while the Eastside was close behind with 12. Of Seattle’s 9 waterfront sales, all but 2 sold in less than 10 days. It was a similar story with Mercer Island’s 6 sales—all but 1 sold in less than 10 days and 4 sold above the asking price. Meydenbauer took the crown for largest waterfront sale, fetching $21.3 million for a truly stunning 1-acre estate with 164 feet of waterfront and a palatial 11,000+ sq. ft. home. The most modest waterfront sale was a Rainier Beach gem on 50 feet of waterfront that sold in just 8 days for $1,725,000.
This brief overview of the entire Seattle-Eastside private waterfront market, including Mercer Island and Lake Sammamish, illustrates the trends occurring in our region over time. This data is interesting and insightful but cannot replace an in-depth waterfront analysis with your trusted professional.
Main photo courtesy of Wing Walker Aerial Photography
We earn the trust and loyalty of our brokers and clients by doing real estate exceptionally well. The leader in our market, we deliver client-focused service in an authentic, collaborative, and transparent manner and with the unmatched knowledge and expertise that comes from decades of experience.
© Copyright 2024, Windermere Real Estate/Mercer Island. Information and statistics derived from Northwest Multiple Listing Service and Trendgraphix, and deemed accurate but not guaranteed. Seattle cover photo courtesy of Codi Nelson and HD Estates Photography. Eastside cover photo courtesy of Donovan Realty Group and Tucker English Photography. Mercer Island cover photo courtesy of Yvonne Willard and Ryan Slimak, Clarity Northwest Photography. Condo cover photo courtesy of Luke Bartlett and Matthew Gallant, Clarity Northwest Photography. Waterfront cover photo courtesy of Kathryn Buchanan and Brandon Larson, Clarity Northwest Photography.
